Datamill
About
We are conceiving a Datenmischwerk made from Open Data and different Open Source Software components.
The journey started with the discussion about open weather data at the Hiveeyes project and today we are running a whole DWD / Climate-Data-Center (CDC) pipeline. By ramping up Luftdatenpumpe, we also started to process data from luftdaten.info.
Spinoffs of those development efforts are taking place at the Panodata Community Forum and the Earth Observations GitHub Organization these days. We are always happy to see like-minded people joining us.
Live data
We are running data pipelines on two machines.
Tools
Earth observations
Wetterdienst - Python Toolset For Accessing Weather Data From German Weather Service.
GribMagic - A generic weather forecast downloader.
Luftdatenpumpe - Process live and historical data from luftdaten.info, IRCELINE and OpenAQ. Filter by station-id, sensor-id and sensor-type, apply reverse geocoding, store into timeseries and RDBMS databases, publish to MQTT, output as JSON or visualize in Grafana.
phenodata - A data acquisition and manipulation toolkit for open access phenology data.
Data acquisition
Kotori - A flexible data historian based on InfluxDB, Grafana, MQTT and more.
Terkin - A datalogger for MicroPython and CPython.
Hiveeyes Firmwares - Arduino firmwares for different MCUs.
mqttwarn - Subscribe to MQTT topics and notify pluggable services.
Grafana
Grafana Map Panel - Fork of the original Grafana Worldmap Panel with improved convenience, robustness and features.
grafana-pandas-datasource - Grafana Python datasource - using Pandas for timeseries and table data.
grafanimate - Animate timeseries data with Grafana.
grafana-wtf - Grep through all Grafana entities in the spirit of git-wtf.
Exhibition
For enjoying more screenshots and details about the projects and tools beyond the tiny exhibition below, you are welcome to visit the Panodata Overview.
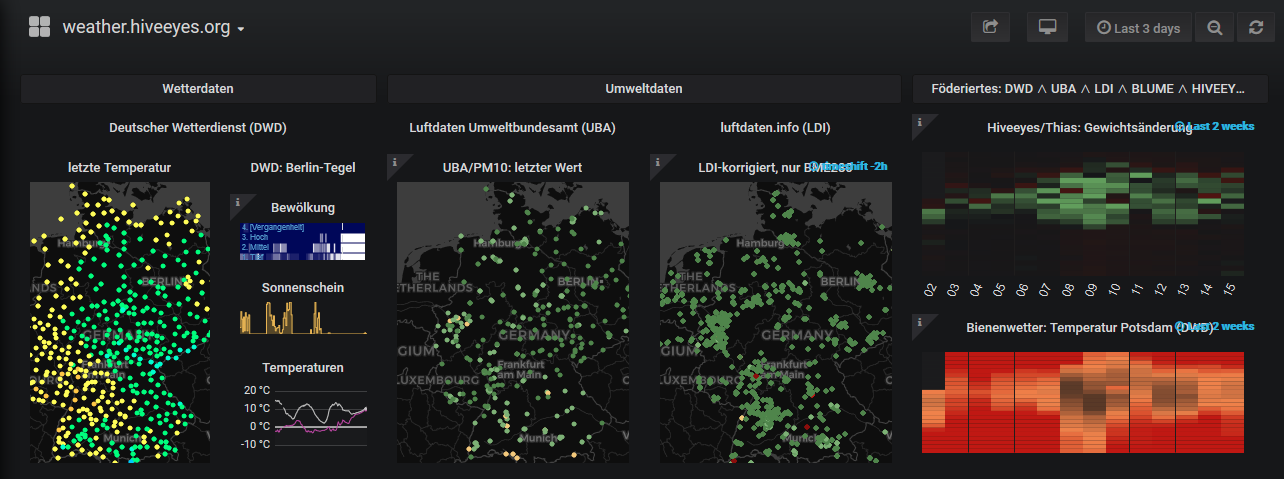
Screenshots
Some Grafana screenshots to get a rough impression how data looks like after coming out of the pipeline.
Presentation at the Geospatial Sensing Conference (GSC2019) in Münster
We are happy to have been invited to talk about the things we are doing around environmental data collection, processing and visualization within the lightning talks section of a GIS-related conference in 2019. The audience was all ears about the capabilities of InfluxDB and Grafana.
More information about the talk.
The presentation slides.
Fancy synthesizing of bee-, weather- and environmental-data with Grafana and InfluxDB
